The Sugar in Your Cereal
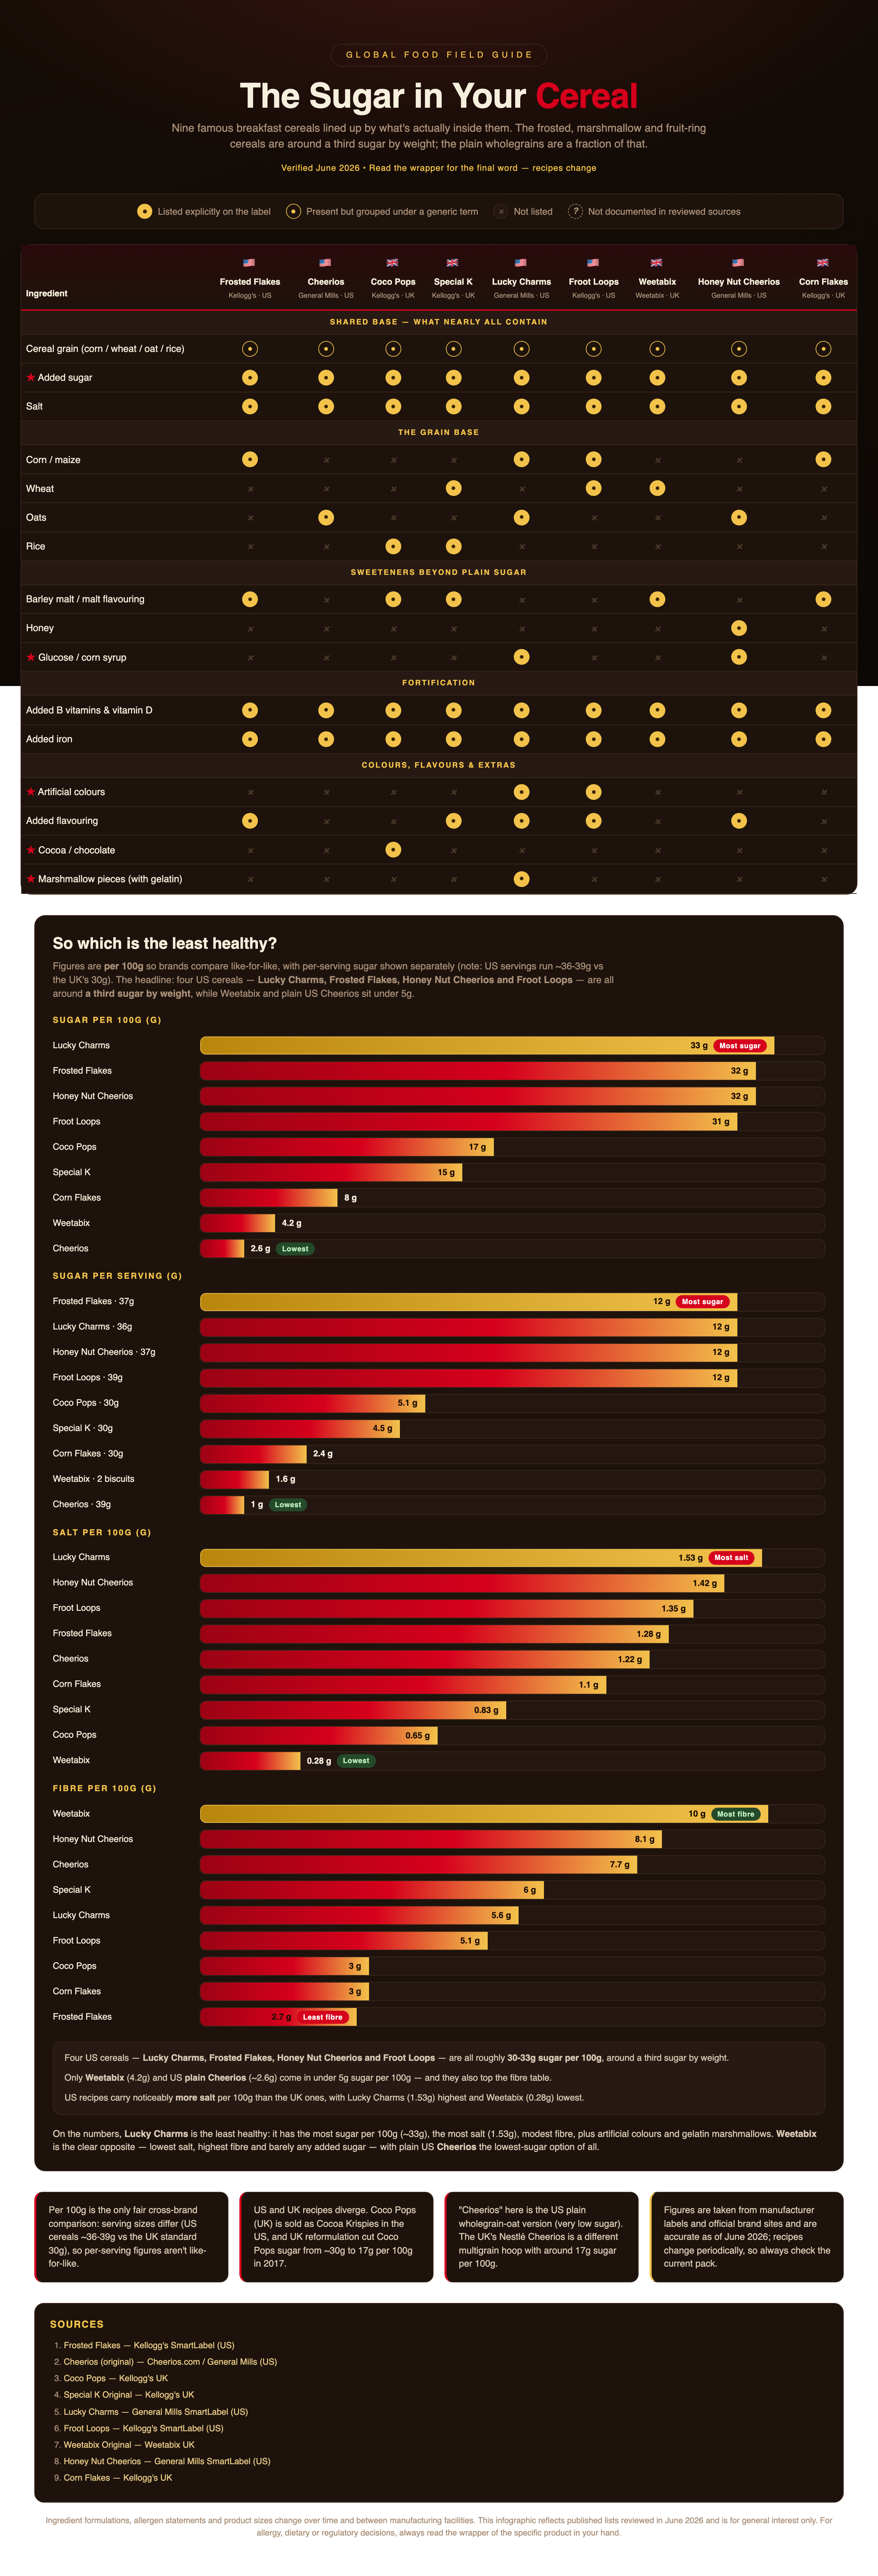
Nine famous breakfast cereals lined up by what's actually inside them. The frosted, marshmallow and fruit-ring cereals are around a third sugar by weight; the plain wholegrains are a fraction of that.
Swipe the table sideways to see every column →
| Ingredient | 🇺🇸 Frosted Flakes Kellogg's · US | 🇺🇸 Cheerios General Mills · US | 🇬🇧 Coco Pops Kellogg's · UK | 🇬🇧 Special K Kellogg's · UK | 🇺🇸 Lucky Charms General Mills · US | 🇺🇸 Froot Loops Kellogg's · US | 🇬🇧 Weetabix Weetabix · UK | 🇺🇸 Honey Nut Cheerios General Mills · US | 🇬🇧 Corn Flakes Kellogg's · UK |
|---|---|---|---|---|---|---|---|---|---|
| Shared base — what nearly all contain | |||||||||
| Cereal grain (corn / wheat / oat / rice) | ● | ● | ● | ● | ● | ● | ● | ● | ● |
| Added sugar | ● | ● | ● | ● | ● | ● | ● | ● | ● |
| Salt | ● | ● | ● | ● | ● | ● | ● | ● | ● |
| The grain base | |||||||||
| Corn / maize | ● | × | × | × | ● | ● | × | × | ● |
| Wheat | × | × | × | ● | × | ● | ● | × | × |
| Oats | × | ● | × | × | ● | × | × | ● | × |
| Rice | × | × | ● | ● | × | × | × | × | × |
| Sweeteners beyond plain sugar | |||||||||
| Barley malt / malt flavouring | ● | × | ● | ● | × | × | ● | × | ● |
| Honey | × | × | × | × | × | × | × | ● | × |
| Glucose / corn syrup | × | × | × | × | ● | × | × | ● | × |
| Fortification | |||||||||
| Added B vitamins & vitamin D | ● | ● | ● | ● | ● | ● | ● | ● | ● |
| Added iron | ● | ● | ● | ● | ● | ● | ● | ● | ● |
| Colours, flavours & extras | |||||||||
| Artificial colours | × | × | × | × | ● | ● | × | × | × |
| Added flavouring | ● | × | × | ● | ● | ● | × | ● | × |
| Cocoa / chocolate | × | × | ● | × | × | × | × | × | × |
| Marshmallow pieces (with gelatin) | × | × | × | × | ● | × | × | × | × |
So which is the least healthy?
Figures are per 100g so brands compare like-for-like, with per-serving sugar shown separately (note: US servings run ~36-39g vs the UK's 30g). The headline: four US cereals — Lucky Charms, Frosted Flakes, Honey Nut Cheerios and Froot Loops — are all around a third sugar by weight, while Weetabix and plain US Cheerios sit under 5g.
On the numbers, Lucky Charms is the least healthy: it has the most sugar per 100g (~33g), the most salt (1.53g), modest fibre, plus artificial colours and gelatin marshmallows. Weetabix is the clear opposite — lowest salt, highest fibre and barely any added sugar — with plain US Cheerios the lowest-sugar option of all.
Per 100g is the only fair cross-brand comparison: serving sizes differ (US cereals ~36-39g vs the UK standard 30g), so per-serving figures aren't like-for-like.
US and UK recipes diverge. Coco Pops (UK) is sold as Cocoa Krispies in the US, and UK reformulation cut Coco Pops sugar from ~30g to 17g per 100g in 2017.
"Cheerios" here is the US plain wholegrain-oat version (very low sugar). The UK's Nestlé Cheerios is a different multigrain hoop with around 17g sugar per 100g.
Figures are taken from manufacturer labels and official brand sites and are accurate as of June 2026; recipes change periodically, so always check the current pack.
Sources
- Frosted Flakes — Kellogg's SmartLabel (US)
- Cheerios (original) — Cheerios.com / General Mills (US)
- Coco Pops — Kellogg's UK
- Special K Original — Kellogg's UK
- Lucky Charms — General Mills SmartLabel (US)
- Froot Loops — Kellogg's SmartLabel (US)
- Weetabix Original — Weetabix UK
- Honey Nut Cheerios — General Mills SmartLabel (US)
- Corn Flakes — Kellogg's UK
Ingredient formulations, allergen statements and product sizes change over time and between manufacturing facilities. This infographic reflects published lists reviewed in June 2026 and is for general interest only. For allergy, dietary or regulatory decisions, always read the wrapper of the specific product in your hand.