What's in an Oreo Around the World?
Every Oreo is two chocolate biscuits sandwiching a vanilla creme — but the recipe quietly changes from country to country. We lined up the labels from seven markets to see what's really inside.
Swipe the table sideways to see every column →
| Ingredient | 🇺🇸 USA | 🇬🇧 UK & Ireland | 🇩🇪 Germany | 🇨🇳 China | 🇮🇳 India | 🇦🇺 Australia | 🇨🇦 Canada |
|---|---|---|---|---|---|---|---|
| What defines it | |||||||
| Two chocolate biscuits + vanilla creme | ● | ● | ● | ● | ● | ● | ● |
| Wheat flour | ● | ● | ● | ● | ● | ● | ● |
| Refined flour / maida specified | × | × | × | × | ● | × | × |
| Enriched / iron- & vitamin-fortified flour | ● | × | × | × | ? | ● | × |
| Sugars & syrups | |||||||
| Sugar | ● | ● | ● | ● | ● | ● | ● |
| High-fructose corn syrup | ● | × | × | × | × | × | × |
| Glucose-fructose syrup | × | ● | ● | × | × | × | ● |
| Glucose syrup | × | × | × | × | × | ● | × |
| Invert sugar syrup | × | × | × | × | ● | × | × |
| No added syrup on label (sugar only) | × | × | × | ● | × | × | × |
| Fats & oils | |||||||
| Palm oil | ● | ● | ● | ● | ● | ● | ● |
| Modified / fractionated palm oil | × | × | × | × | × | × | ● |
| Canola / rapeseed oil | ● | ● | ● | × | × | × | ● |
| Unspecified edible vegetable oil/fat | × | × | × | ● | ● | ● | × |
| Cocoa & flavour | |||||||
| Cocoa | ● | ● | ● | ● | ● | ● | ● |
| Cocoa processed with alkali (Dutched) | ● | × | × | × | × | × | × |
| Fat-reduced cocoa powder | × | ● | ● | × | × | × | × |
| Added chocolate / unsweetened chocolate | ● | × | × | × | × | × | ● |
| Natural / unspecified flavouring | × | ● | ● | ● | × | ● | × |
| Vanillin / synthetic flavouring | × | ● | ● | × | ● | × | × |
| Artificial flavour | ● | × | × | × | × | × | ● |
| Other ingredients | |||||||
| Wheat / corn starch | ? | ● | ● | ● | ● | × | ● |
| Salt | ● | ● | ● | ● | × | ● | ● |
| Iodised salt | × | × | × | × | ● | × | × |
| Soy / soya lecithin | ● | ● | ● | ● | ● | ● | ● |
| Sunflower lecithin | × | ● | ● | × | × | × | × |
| Raising agents (E500 / E503 / baking soda) | ● | ● | ● | ● | ● | ● | ● |
| Acidity regulator (sodium hydroxide / citric acid) | × | ● | ● | ● | × | × | × |
| Antioxidants (e.g. E319) | × | × | × | × | × | ● | × |
| Contains / may contain milk | × | ● | ● | ● | × | ● | × |
So which is the least healthy?
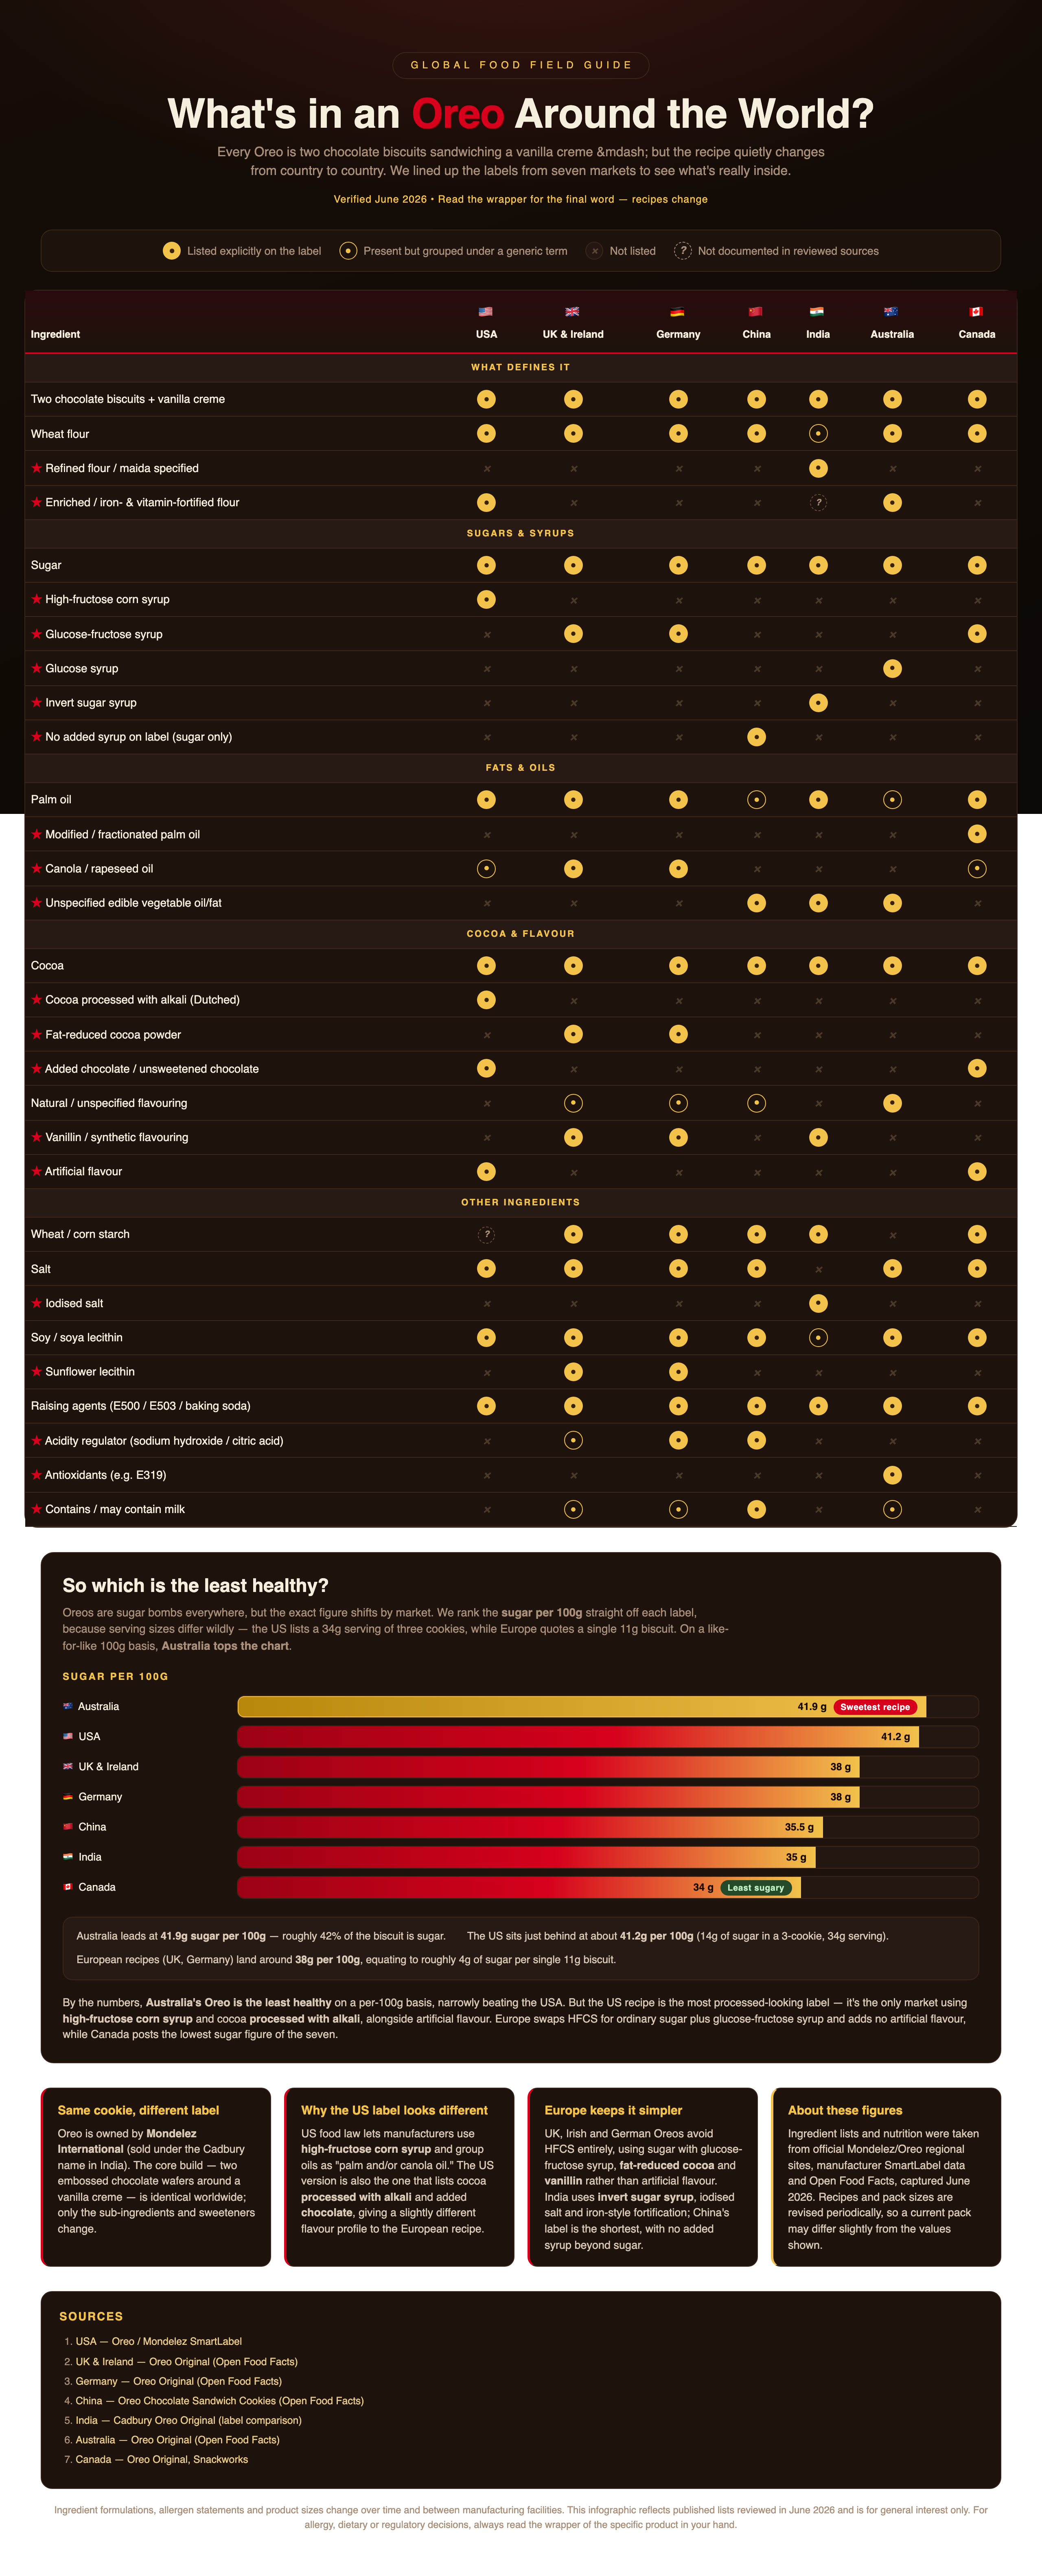
Oreos are sugar bombs everywhere, but the exact figure shifts by market. We rank the sugar per 100g straight off each label, because serving sizes differ wildly — the US lists a 34g serving of three cookies, while Europe quotes a single 11g biscuit. On a like-for-like 100g basis, Australia tops the chart.
By the numbers, Australia's Oreo is the least healthy on a per-100g basis, narrowly beating the USA. But the US recipe is the most processed-looking label — it's the only market using high-fructose corn syrup and cocoa processed with alkali, alongside artificial flavour. Europe swaps HFCS for ordinary sugar plus glucose-fructose syrup and adds no artificial flavour, while Canada posts the lowest sugar figure of the seven.
Same cookie, different label
Oreo is owned by Mondelez International (sold under the Cadbury name in India). The core build — two embossed chocolate wafers around a vanilla creme — is identical worldwide; only the sub-ingredients and sweeteners change.
Why the US label looks different
US food law lets manufacturers use high-fructose corn syrup and group oils as "palm and/or canola oil." The US version is also the one that lists cocoa processed with alkali and added chocolate, giving a slightly different flavour profile to the European recipe.
Europe keeps it simpler
UK, Irish and German Oreos avoid HFCS entirely, using sugar with glucose-fructose syrup, fat-reduced cocoa and vanillin rather than artificial flavour. India uses invert sugar syrup, iodised salt and iron-style fortification; China's label is the shortest, with no added syrup beyond sugar.
About these figures
Ingredient lists and nutrition were taken from official Mondelez/Oreo regional sites, manufacturer SmartLabel data and Open Food Facts, captured June 2026. Recipes and pack sizes are revised periodically, so a current pack may differ slightly from the values shown.
Sources
- USA — Oreo / Mondelez SmartLabel
- UK & Ireland — Oreo Original (Open Food Facts)
- Germany — Oreo Original (Open Food Facts)
- China — Oreo Chocolate Sandwich Cookies (Open Food Facts)
- India — Cadbury Oreo Original (label comparison)
- Australia — Oreo Original (Open Food Facts)
- Canada — Oreo Original, Snackworks
Ingredient formulations, allergen statements and product sizes change over time and between manufacturing facilities. This infographic reflects published lists reviewed in June 2026 and is for general interest only. For allergy, dietary or regulatory decisions, always read the wrapper of the specific product in your hand.