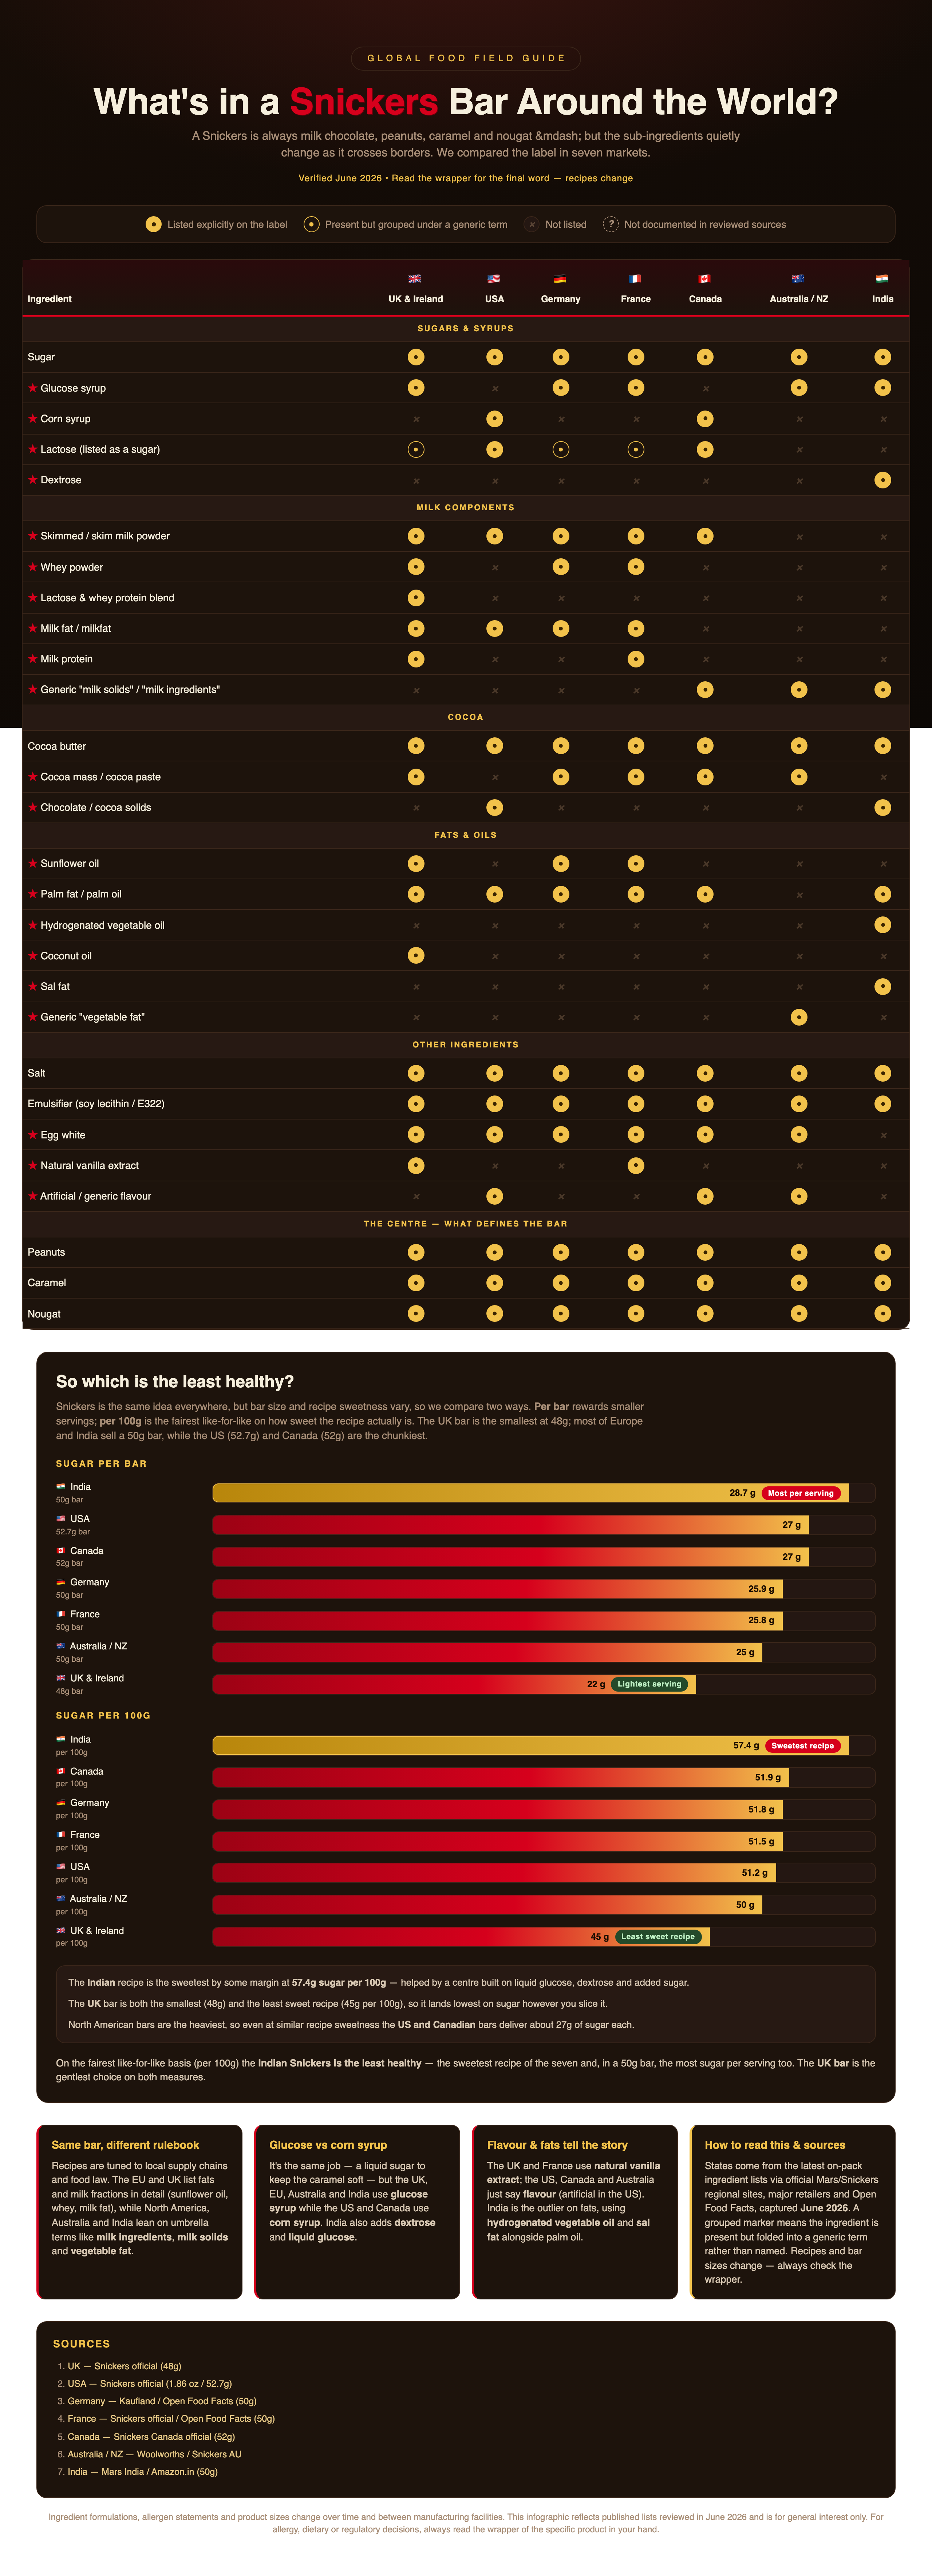
What's in a Snickers Bar Around the World?
A Snickers is always milk chocolate, peanuts, caramel and nougat — but the sub-ingredients quietly change as it crosses borders. We compared the label in seven markets.
Swipe the table sideways to see every column →
| Ingredient | 🇬🇧 UK & Ireland | 🇺🇸 USA | 🇩🇪 Germany | 🇫🇷 France | 🇨🇦 Canada | 🇦🇺 Australia / NZ | 🇮🇳 India |
|---|---|---|---|---|---|---|---|
| Sugars & syrups | |||||||
| Sugar | ● | ● | ● | ● | ● | ● | ● |
| Glucose syrup | ● | × | ● | ● | × | ● | ● |
| Corn syrup | × | ● | × | × | ● | × | × |
| Lactose (listed as a sugar) | ● | ● | ● | ● | ● | × | × |
| Dextrose | × | × | × | × | × | × | ● |
| Milk components | |||||||
| Skimmed / skim milk powder | ● | ● | ● | ● | ● | × | × |
| Whey powder | ● | × | ● | ● | × | × | × |
| Lactose & whey protein blend | ● | × | × | × | × | × | × |
| Milk fat / milkfat | ● | ● | ● | ● | × | × | × |
| Milk protein | ● | × | × | ● | × | × | × |
| Generic "milk solids" / "milk ingredients" | × | × | × | × | ● | ● | ● |
| Cocoa | |||||||
| Cocoa butter | ● | ● | ● | ● | ● | ● | ● |
| Cocoa mass / cocoa paste | ● | × | ● | ● | ● | ● | × |
| Chocolate / cocoa solids | × | ● | × | × | × | × | ● |
| Fats & oils | |||||||
| Sunflower oil | ● | × | ● | ● | × | × | × |
| Palm fat / palm oil | ● | ● | ● | ● | ● | × | ● |
| Hydrogenated vegetable oil | × | × | × | × | × | × | ● |
| Coconut oil | ● | × | × | × | × | × | × |
| Sal fat | × | × | × | × | × | × | ● |
| Generic "vegetable fat" | × | × | × | × | × | ● | × |
| Other ingredients | |||||||
| Salt | ● | ● | ● | ● | ● | ● | ● |
| Emulsifier (soy lecithin / E322) | ● | ● | ● | ● | ● | ● | ● |
| Egg white | ● | ● | ● | ● | ● | ● | × |
| Natural vanilla extract | ● | × | × | ● | × | × | × |
| Artificial / generic flavour | × | ● | × | × | ● | ● | × |
| The centre — what defines the bar | |||||||
| Peanuts | ● | ● | ● | ● | ● | ● | ● |
| Caramel | ● | ● | ● | ● | ● | ● | ● |
| Nougat | ● | ● | ● | ● | ● | ● | ● |
So which is the least healthy?
Snickers is the same idea everywhere, but bar size and recipe sweetness vary, so we compare two ways. Per bar rewards smaller servings; per 100g is the fairest like-for-like on how sweet the recipe actually is. The UK bar is the smallest at 48g; most of Europe and India sell a 50g bar, while the US (52.7g) and Canada (52g) are the chunkiest.
On the fairest like-for-like basis (per 100g) the Indian Snickers is the least healthy — the sweetest recipe of the seven and, in a 50g bar, the most sugar per serving too. The UK bar is the gentlest choice on both measures.
Same bar, different rulebook
Recipes are tuned to local supply chains and food law. The EU and UK list fats and milk fractions in detail (sunflower oil, whey, milk fat), while North America, Australia and India lean on umbrella terms like milk ingredients, milk solids and vegetable fat.
Glucose vs corn syrup
It's the same job — a liquid sugar to keep the caramel soft — but the UK, EU, Australia and India use glucose syrup while the US and Canada use corn syrup. India also adds dextrose and liquid glucose.
Flavour & fats tell the story
The UK and France use natural vanilla extract; the US, Canada and Australia just say flavour (artificial in the US). India is the outlier on fats, using hydrogenated vegetable oil and sal fat alongside palm oil.
How to read this & sources
States come from the latest on-pack ingredient lists via official Mars/Snickers regional sites, major retailers and Open Food Facts, captured June 2026. A grouped marker means the ingredient is present but folded into a generic term rather than named. Recipes and bar sizes change — always check the wrapper.
Sources
Ingredient formulations, allergen statements and product sizes change over time and between manufacturing facilities. This infographic reflects published lists reviewed in June 2026 and is for general interest only. For allergy, dietary or regulatory decisions, always read the wrapper of the specific product in your hand.