What's Really in Your Soda?
We lined up nine of the world's best-selling soft drinks and read every label. Same fizzy water, wildly different sugar, caffeine, sweeteners and dyes.
Swipe the table sideways to see every column →
| Ingredient | 🇺🇸 Coca-Cola Coca-Cola Co · US | 🇺🇸 Pepsi PepsiCo · US | 🇺🇸 Sprite Coca-Cola Co · US | 🇺🇸 Fanta Orange Coca-Cola Co · US | 🇺🇸 Dr Pepper Keurig Dr Pepper · US | 🇺🇸 7Up Keurig Dr Pepper · US | 🇺🇸 Mountain Dew PepsiCo · US | 🇺🇸 Coca-Cola Zero Sugar Coca-Cola Co · US | 🇺🇸 Diet Coke Coca-Cola Co · US |
|---|---|---|---|---|---|---|---|---|---|
| Shared base — what nearly all contain | |||||||||
| Carbonated water | ● | ● | ● | ● | ● | ● | ● | ● | ● |
| Natural flavors | ● | ● | ● | ● | ● | ● | ● | ● | ● |
| Caffeine | ● | ● | × | × | ● | × | ● | ● | ● |
| Sweeteners — sugar vs. substitutes | |||||||||
| High-fructose corn syrup | ● | ● | ● | ● | ● | ● | ● | × | × |
| Sugar (added alongside HFCS) | × | ● | × | × | × | × | × | × | × |
| Aspartame | × | × | × | × | × | × | × | ● | ● |
| Acesulfame potassium (Ace-K) | × | × | × | × | × | × | × | ● | × |
| Acids — the tang & the bite | |||||||||
| Phosphoric acid | ● | ● | × | × | ● | × | × | ● | ● |
| Citric acid | × | ● | ● | ● | × | ● | ● | × | ● |
| Colours | |||||||||
| Caramel color | ● | ● | × | × | ● | × | × | ● | ● |
| Yellow 6 | × | × | × | ● | × | × | × | × | × |
| Red 40 | × | × | × | ● | × | × | × | × | × |
| Yellow 5 (tartrazine) | × | × | × | × | × | × | ● | × | × |
| Preservatives & stabilizers | |||||||||
| Sodium benzoate | × | × | ● | ● | ● | × | ● | × | × |
| Potassium benzoate | × | × | × | × | × | ● | × | ● | ● |
| Calcium disodium EDTA | × | × | × | × | × | ● | ● | × | × |
| Citrate salts (sodium/potassium citrate) | × | × | ● | × | × | ● | ● | ● | × |
| Distinctive extras | |||||||||
| Orange juice (from concentrate) | × | × | × | × | × | × | ● | × | × |
| Glycerol ester of rosin | × | × | × | ● | × | × | ● | × | × |
| Gum arabic | × | × | × | × | × | × | ● | × | × |
| Modified food starch | × | × | × | ● | × | × | × | × | × |
So which is the least healthy?
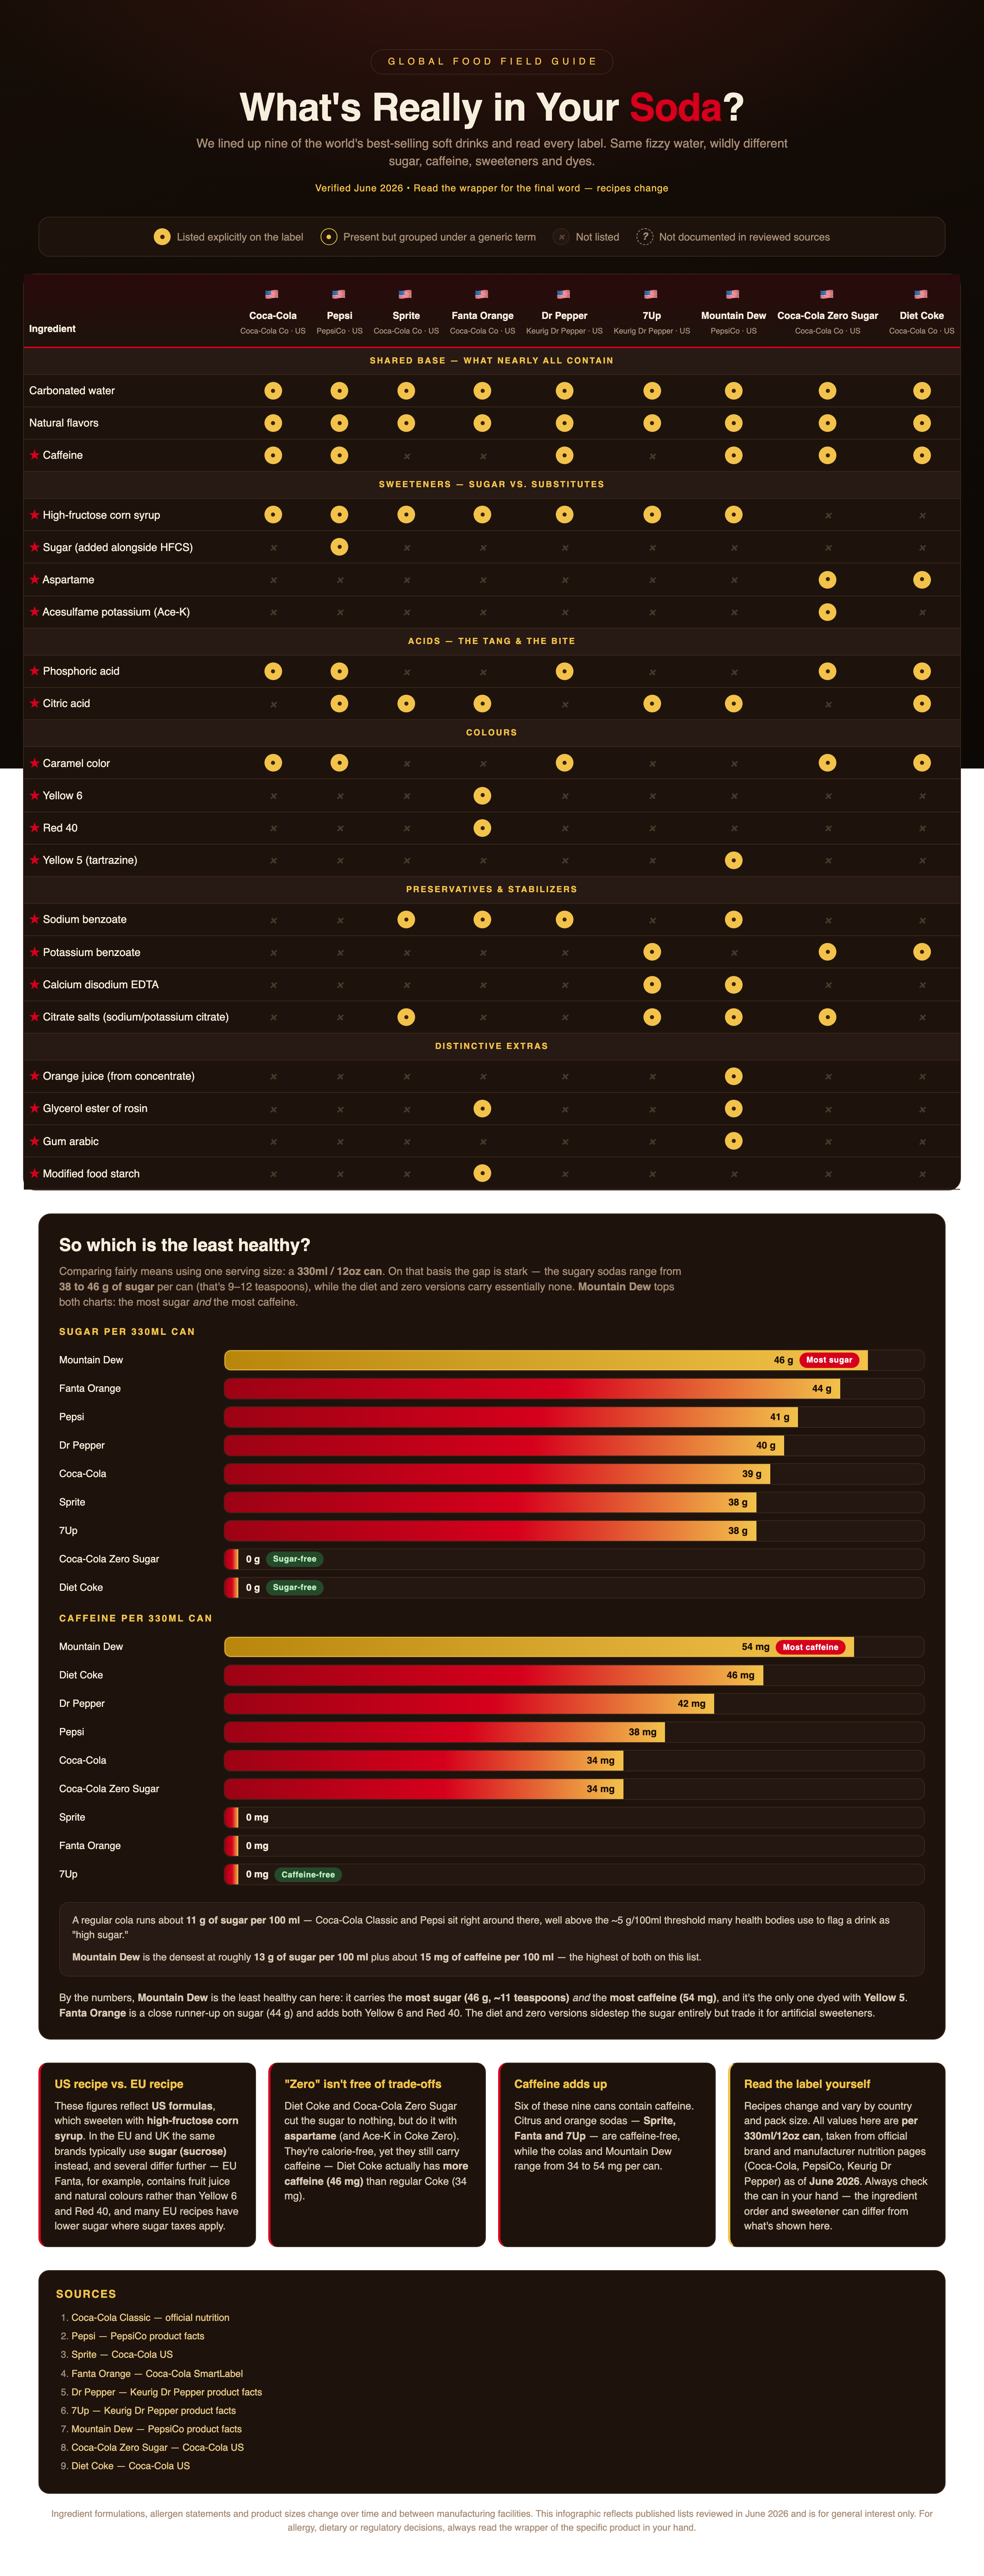
Comparing fairly means using one serving size: a 330ml / 12oz can. On that basis the gap is stark — the sugary sodas range from 38 to 46 g of sugar per can (that's 9–12 teaspoons), while the diet and zero versions carry essentially none. Mountain Dew tops both charts: the most sugar and the most caffeine.
By the numbers, Mountain Dew is the least healthy can here: it carries the most sugar (46 g, ~11 teaspoons) and the most caffeine (54 mg), and it's the only one dyed with Yellow 5. Fanta Orange is a close runner-up on sugar (44 g) and adds both Yellow 6 and Red 40. The diet and zero versions sidestep the sugar entirely but trade it for artificial sweeteners.
US recipe vs. EU recipe
These figures reflect US formulas, which sweeten with high-fructose corn syrup. In the EU and UK the same brands typically use sugar (sucrose) instead, and several differ further — EU Fanta, for example, contains fruit juice and natural colours rather than Yellow 6 and Red 40, and many EU recipes have lower sugar where sugar taxes apply.
"Zero" isn't free of trade-offs
Diet Coke and Coca-Cola Zero Sugar cut the sugar to nothing, but do it with aspartame (and Ace-K in Coke Zero). They're calorie-free, yet they still carry caffeine — Diet Coke actually has more caffeine (46 mg) than regular Coke (34 mg).
Caffeine adds up
Six of these nine cans contain caffeine. Citrus and orange sodas — Sprite, Fanta and 7Up — are caffeine-free, while the colas and Mountain Dew range from 34 to 54 mg per can.
Read the label yourself
Recipes change and vary by country and pack size. All values here are per 330ml/12oz can, taken from official brand and manufacturer nutrition pages (Coca-Cola, PepsiCo, Keurig Dr Pepper) as of June 2026. Always check the can in your hand — the ingredient order and sweetener can differ from what's shown here.
Sources
Ingredient formulations, allergen statements and product sizes change over time and between manufacturing facilities. This infographic reflects published lists reviewed in June 2026 and is for general interest only. For allergy, dietary or regulatory decisions, always read the wrapper of the specific product in your hand.